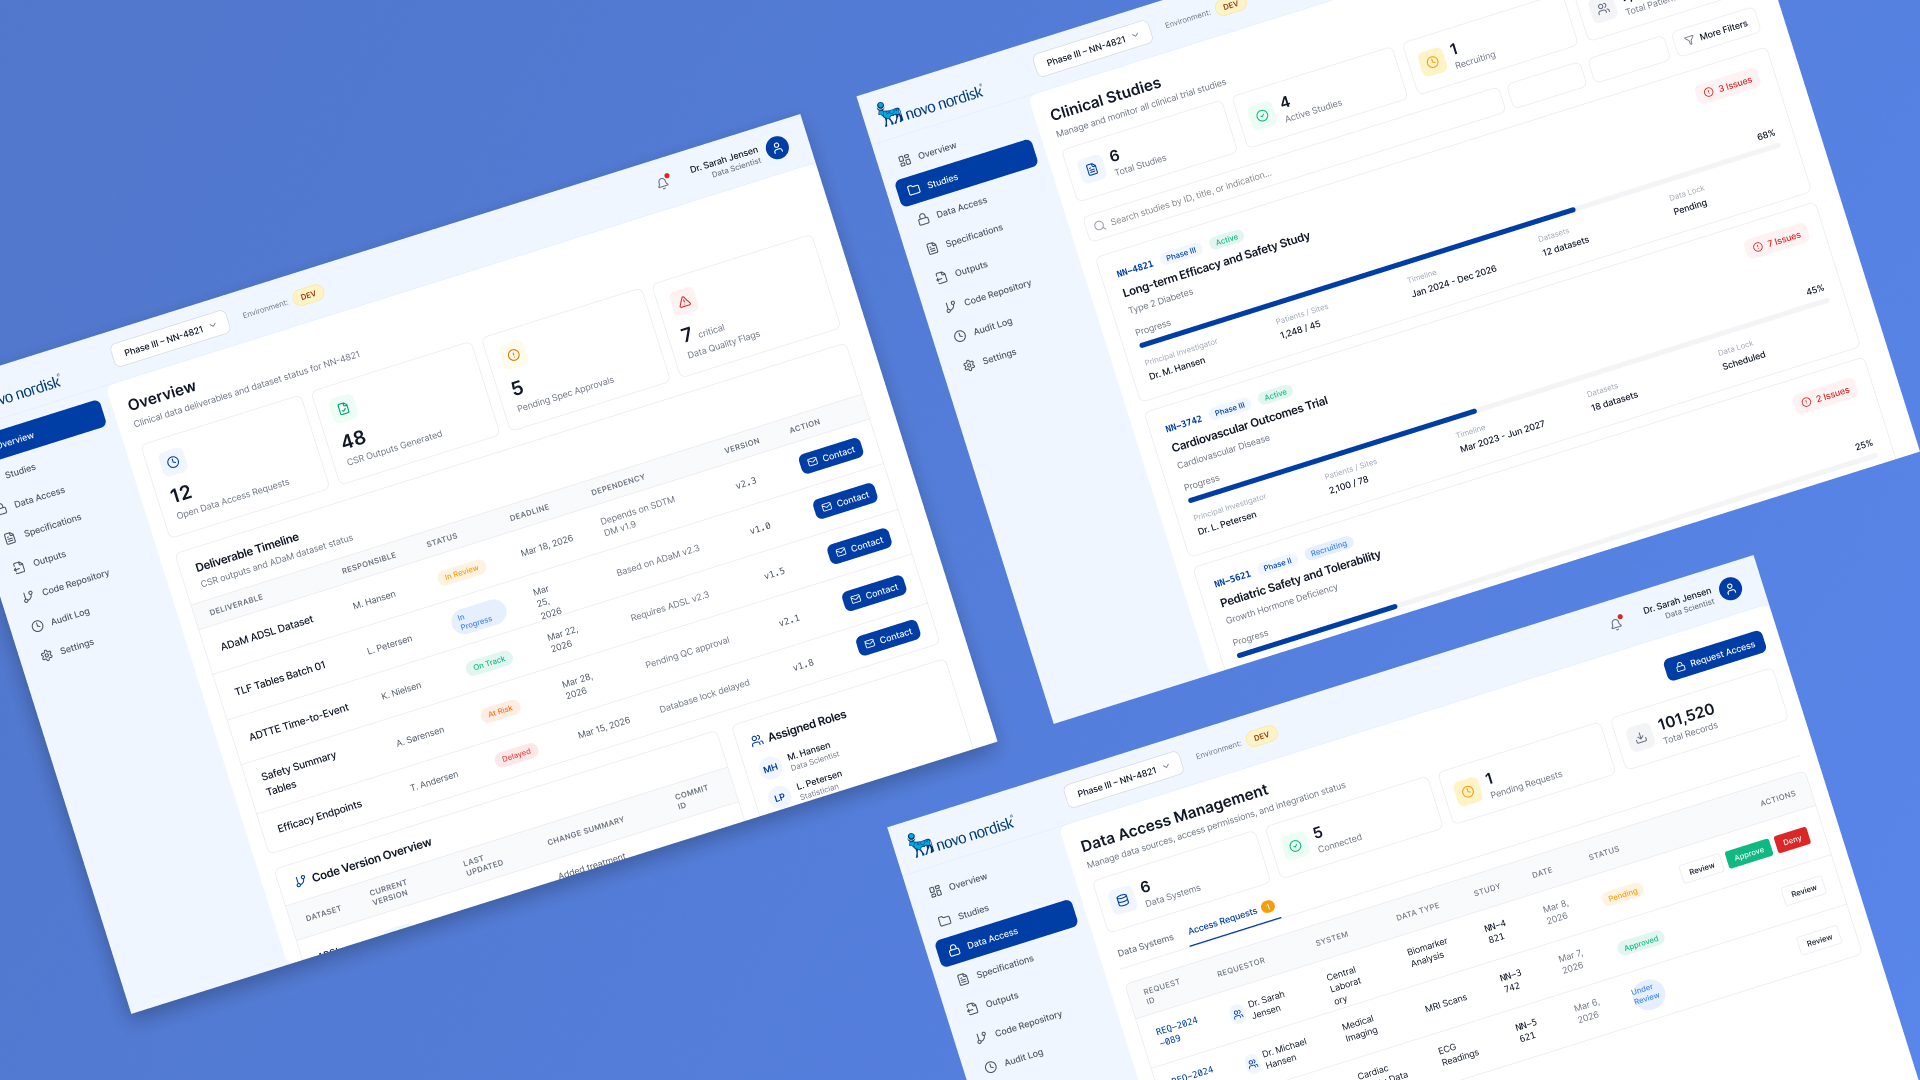
UX research at Novo Nordisk's Clinical Analytics Department
The Clinical Analytics Department at Novo Nordisk had a problem that nobody had formally named: development was running on assumptions. Teams knew the systems, but had little validated understanding of the people using them, how work actually moved between those people, or where the real bottlenecks were.
I joined as the sole UX designer with a mandate to build that foundation. Before any solution thinking could begin, a clear and shared picture of the current state had to exist.
Decisions were being made without a clear picture of who the users were. Workflows existed only in people's heads. Critical handovers and dependencies were informal and undocumented, which made them invisible to the teams responsible for improving them.
This was the constraint that shaped everything: you cannot design for a system you cannot see. The research approach had to make the invisible visible before anything else could move forward.
Initial assumptions only covered a subset of users, overlooking important contributors to the overall workflow. To get past this, I combined legacy system login data analysis with more than 30 interviews and workshops across the organisation.
That combination surfaced both the primary user group and a set of secondary users who had never been formally recognised. Their workflows were real, their dependencies were significant, and they had been completely absent from product decisions until this point.
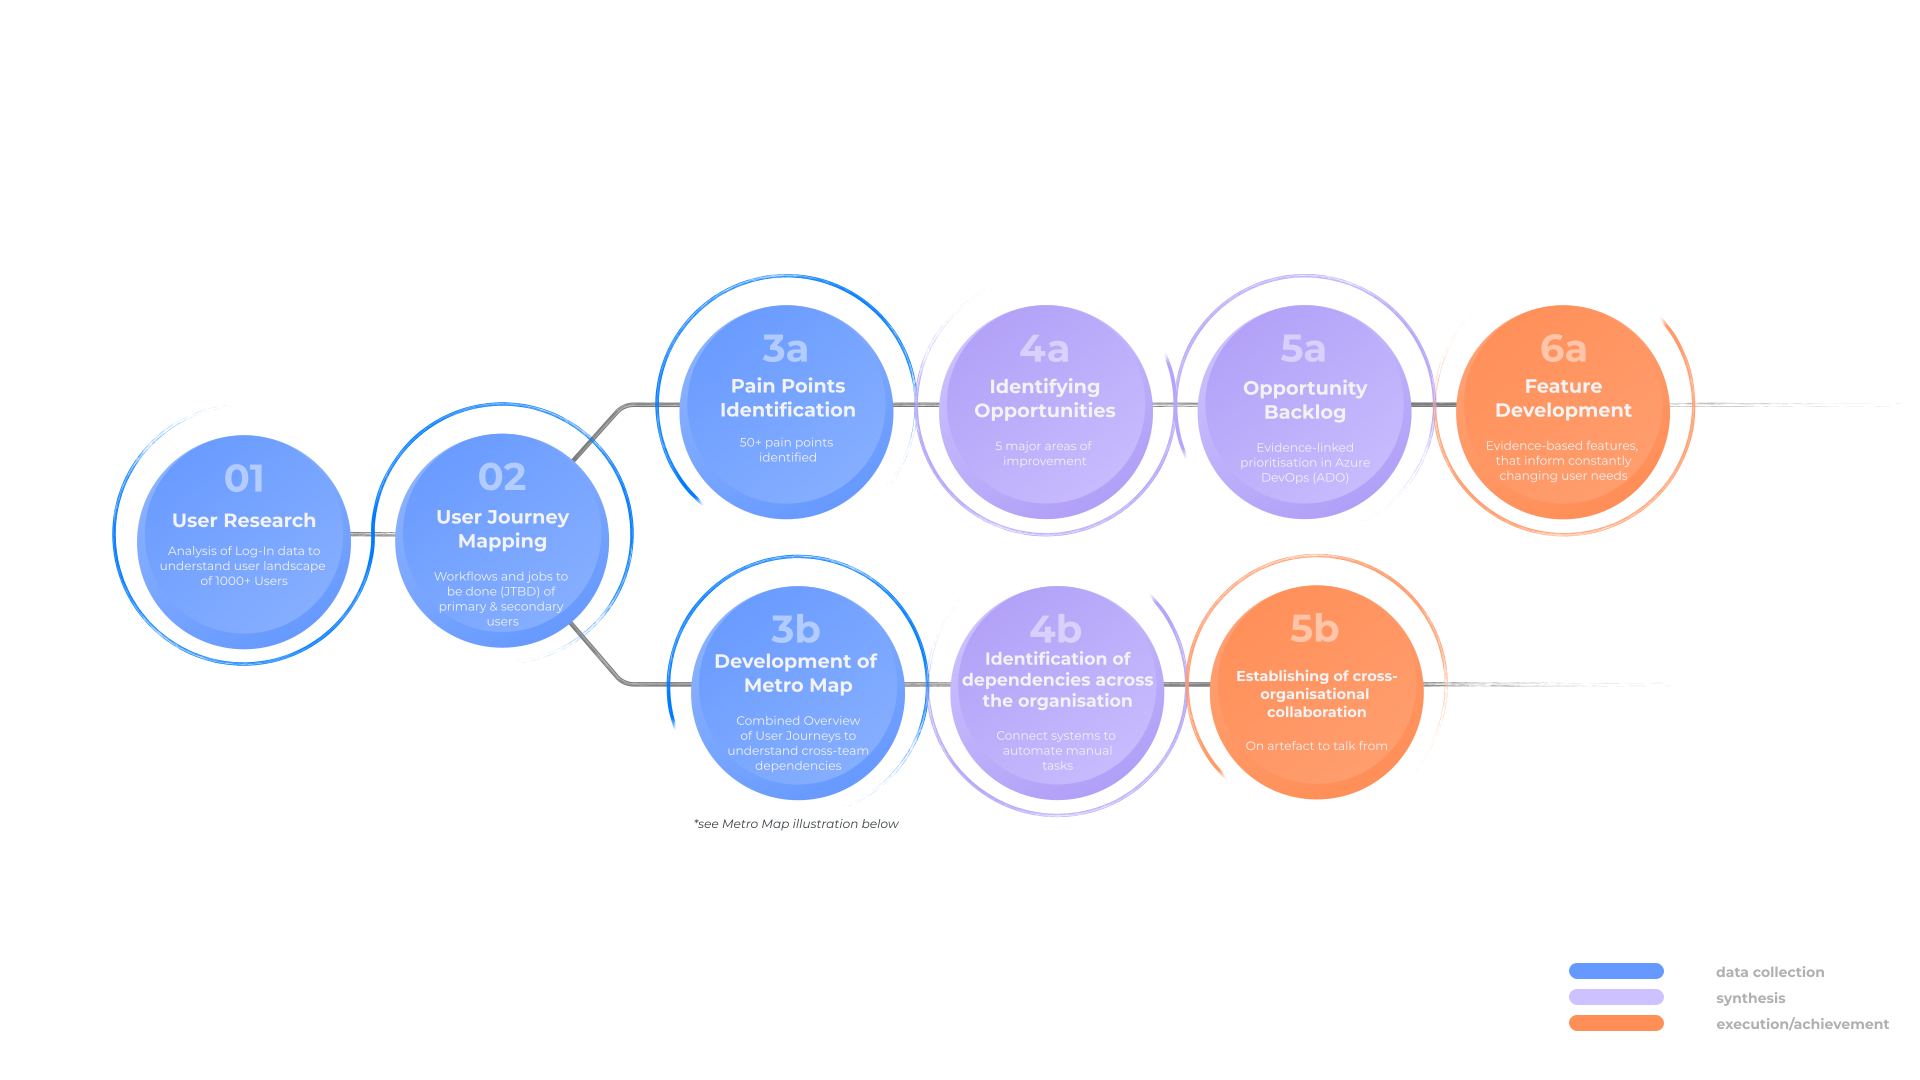
Five phase research process: discovery, user mapping, pain point clustering, workflow documentation, and backlog integration.
Knowing who the users were was only part of the problem. The other part was understanding how work actually moved between them across systems and teams. Critical handovers, bottlenecks, and dependencies across teams had never been documented, which meant alignment across the department was happening without a common map.
I translated the research into a visual "metro map" capturing full workflows, system interactions, and dependencies between user groups. It gave every team a shared reference they could point to, argue against, and build from.
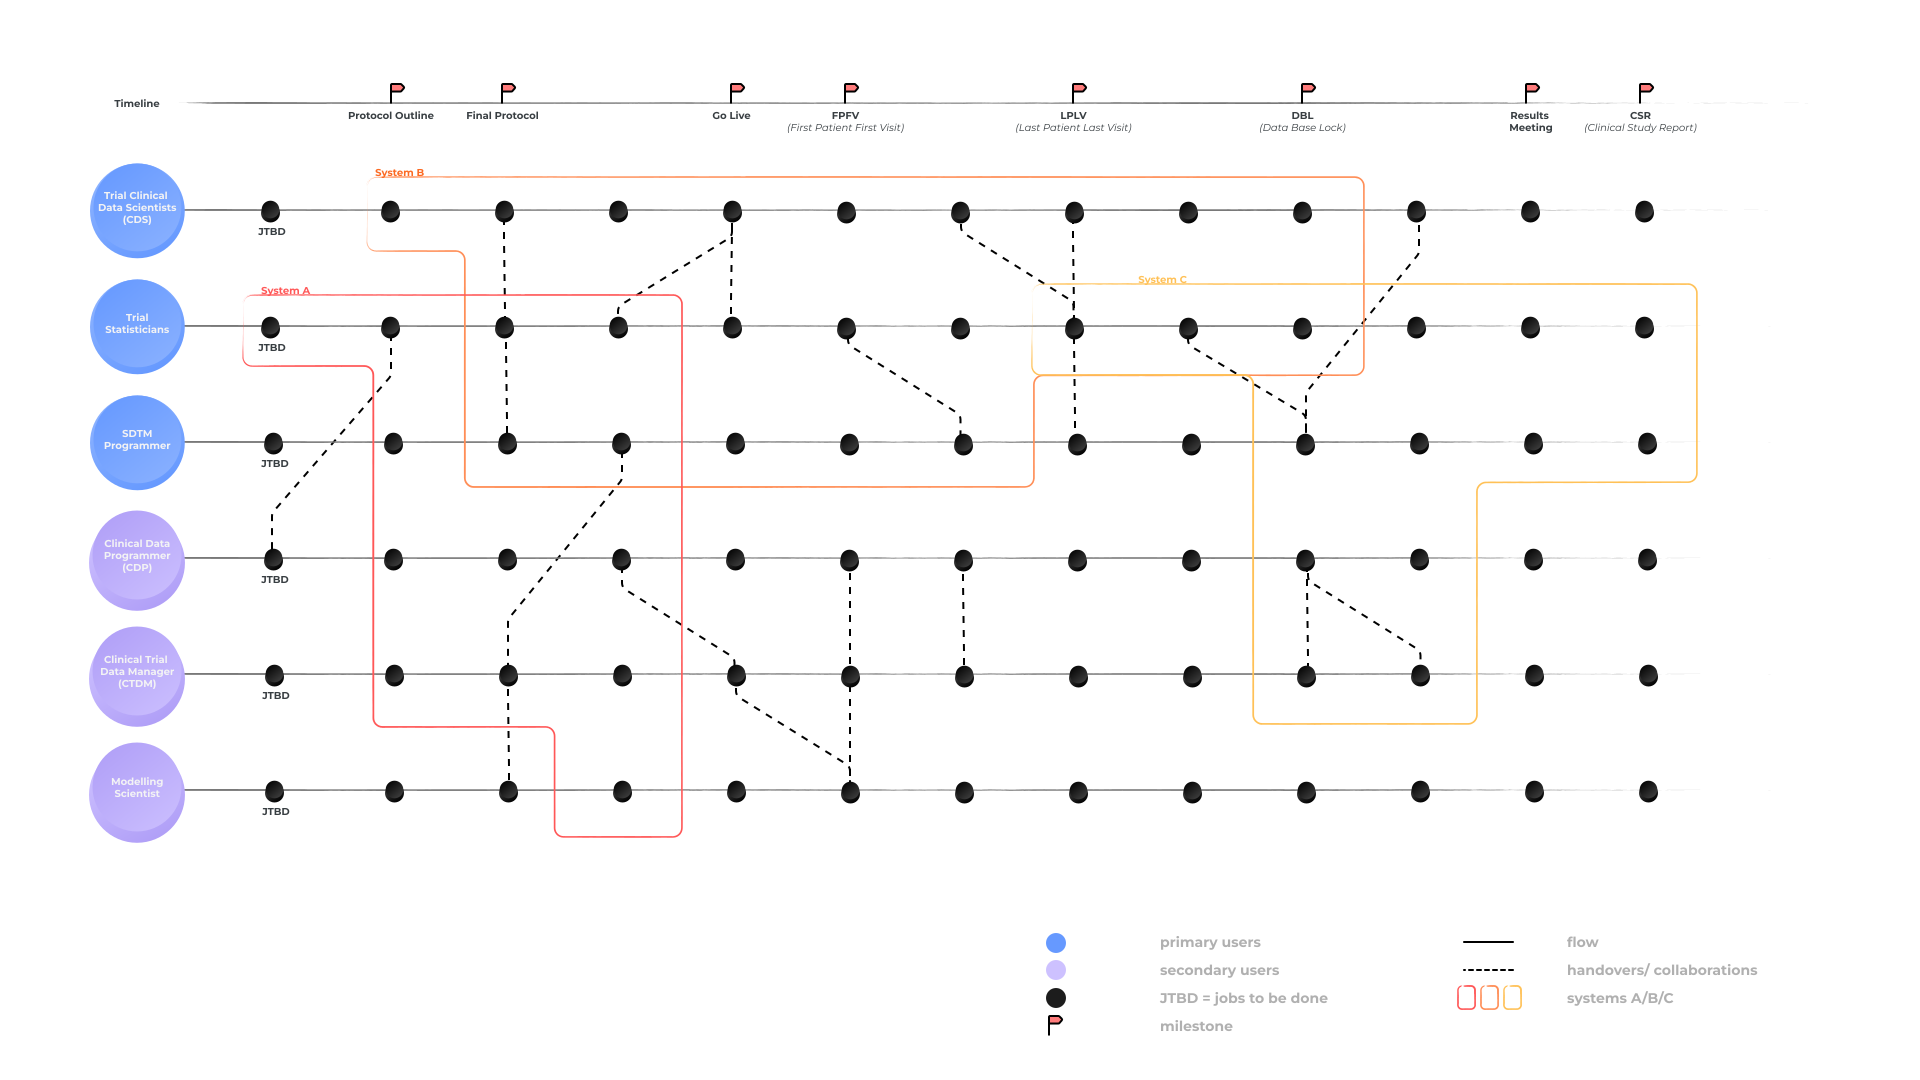
Metro map translating full workflows, system interactions, and dependencies between user groups into a shared visual reference.
Research that lives in a deck gets forgotten. The real challenge was making sure the findings stayed active once the interviews were done. In a fast moving department environment, insights disconnected from the development workflow quickly lose relevance.
I embedded UX directly into team processes by building a backlog in Azure DevOps grounded in research. Pain points, user needs, and opportunities were documented as actionable items, traceable back to the evidence behind them. Teams could prioritise based on validated needs rather than gut feel.
Three things emerged from the research that the department had not previously seen clearly:
Legacy system data combined with interviews surfaced secondary user groups that had never been formally recognised. Their workflows were real, their impact on outcomes was significant, and they had been entirely absent from product planning.
Processes across teams had never been written down. Handovers were informal, dependencies were assumed, and there was no shared picture of how work moved end to end. Making that visible was a prerequisite for improving anything.
Clinical analytics workflows were tightly connected to other initiatives critical to the business that the team had not mapped. Surfacing those connections early allowed teams to align with broader organisational efforts before misalignment became costly.
The research shifted the department from development driven by assumption to a shared, user centred foundation. Teams had a validated picture of their users, a documented map of full workflows, and a backlog tied directly to real needs. The work fed into a five year strategic product vision and established UX as a standing part of how the department makes decisions.